
Just Charts This Week
Just Charts This Week
Burisma Chief: "My Dog is Smarter Than Hunter."

The Gladstone
Economic Newsletter
Volume 18, No. 10
August 3, 2023
Just Charts This Week.
Burisma Chief: “My dog is smarter than Hunter.”
DISCLAIMER: The following is not intended as investment advice, but is rather intended to promote your own analysis of markets and the economic climate. The author is not a registered investment professional. Any action taken as a result of this analysis carries a high degree of risk. This newsletter contains the personal opinion of the author.
Dear Readers-
I extend my apologies for the delay in my newsletters, as I have been a bit preoccupied on other matters.
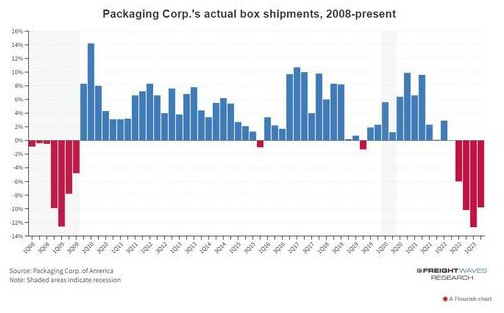
We are inundated on a daily basis with progaganda on a “soft landing,” “no recession,” and the biggest lie of all being the success of “Bidenomics.” I suggest that anyone who doesn’t think we are in a recession take a look at cardboard box production figures. The economy survives on cardboard boxes, and Packaging Corp. of America is a huge cardboard box producer. The economy is mirroring 2008-2009!
Zerohedge published the following chart showing a 14 month decline in the Leading Economic Indicators index. Actually, we have now had 15 straight months of declines in the LEI. I have criticized the LEI in the past since it heavily weights the performance of the stock market. Considering we have had a large rally in the equities (back to a massive bubble level) since October, to have the LEI continue to decline is very worrying:

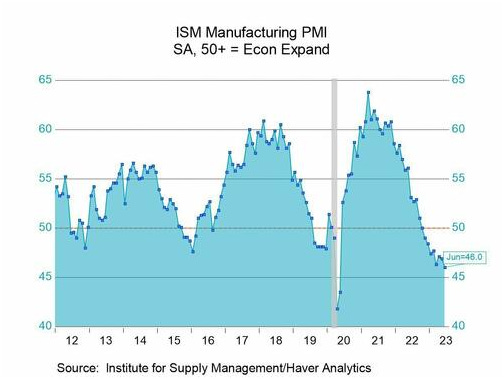
The ISM Manufacturing Purchasing Managers Index is well below 50, signaling a large contraction, confirms the cardboard box chart.
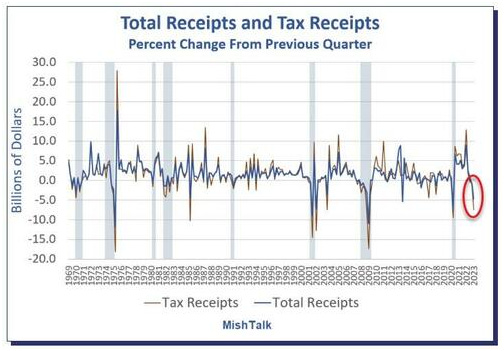
Mike Shedlock published the following chart on Federal Total Receipts and Tax Receipts. As Scooby Doo would say, “Rut Roh!”
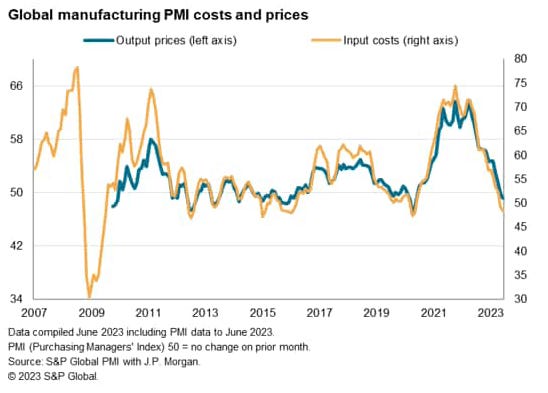
Markit created the following chart of the Global Manufacturing PMI, and it was published by seekingalpha.com:
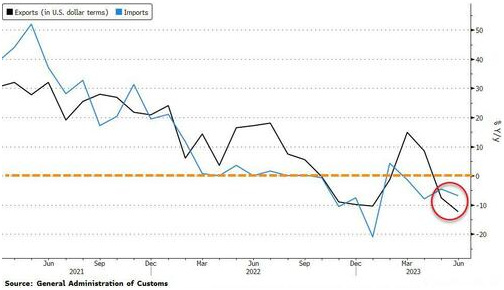
Chinese manufacturing collapse is in a pronounced collapse. The data below is from the Chinese Customs Administration. I have seen many youtube videos showing empty factories in China, empty shops and restaurants (up to 500,000 restaurants have closed!) and other massive economic pain in China:
Bidenomics in action chart, from zerohedge.com:

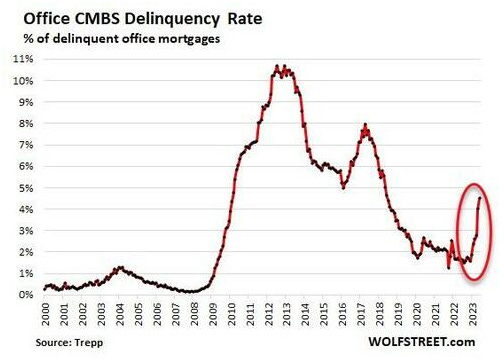
The credit delinquency cycle in Commercial Mortgage Backed Securities is well in play, and expectations are for losses to well exceed 2009-2013:
Avi Gilburt published the following chart showing US banks paper losses on US Treasury bond positions. The banking crisis is far from over. It has just been delayed for a while.

All of the above charts lead to one conclusion: The equity markets have been massively propped up and are due for a very large decline. Captain E-wave published the following chart of what Elliot Wave Theory calls for:

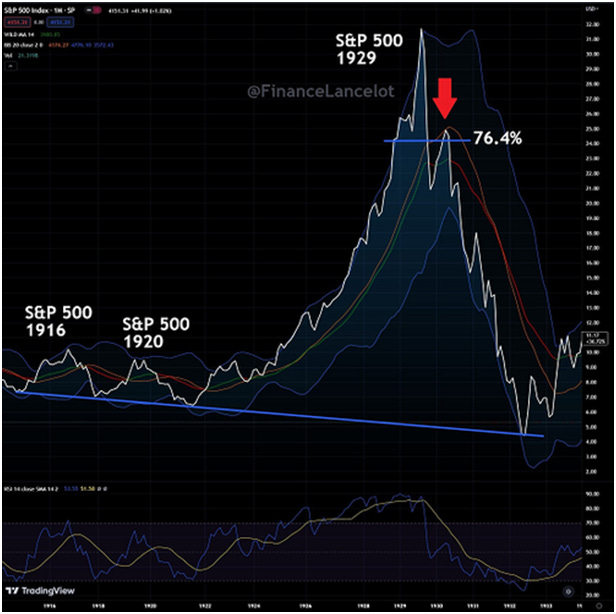
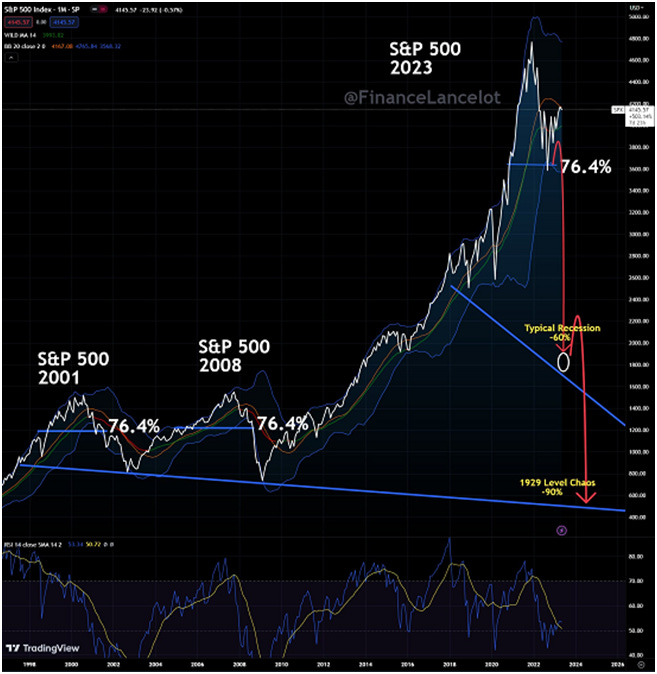
Charles Hugh Smith published the following two charts showing that a potential 1929 replay may happen, and that the current target is perhaps 500 or less on the S&P 500 if this plays out:
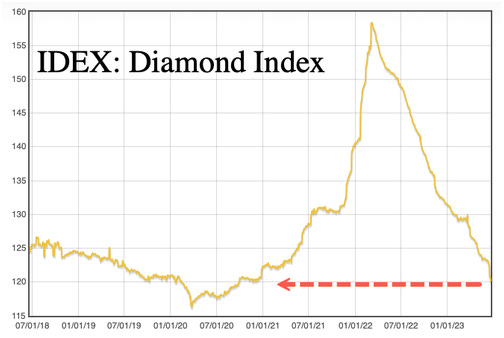
The world consumer is back at 2020 levels, if the following chart on diamond prices is an indicator. The chart was published by Zerohedge.com. Anecdotally, I have seen the travel sector bookings taking a huge hit, with airfares on sale routinely in the last few weeks, and cruise ship fares being put on large sales. I managed to book a Denver to Syracuse direct flight round trip for this month for $157.
I will leave you with two items to close this newsletter. The population of Germany is getting well fed up with their sacrifices for Ukraine. The following video is both chilling and funny:
For many years I have written about “my evil twin Skippy.” I very much identify (somehow) with the following graphic:
